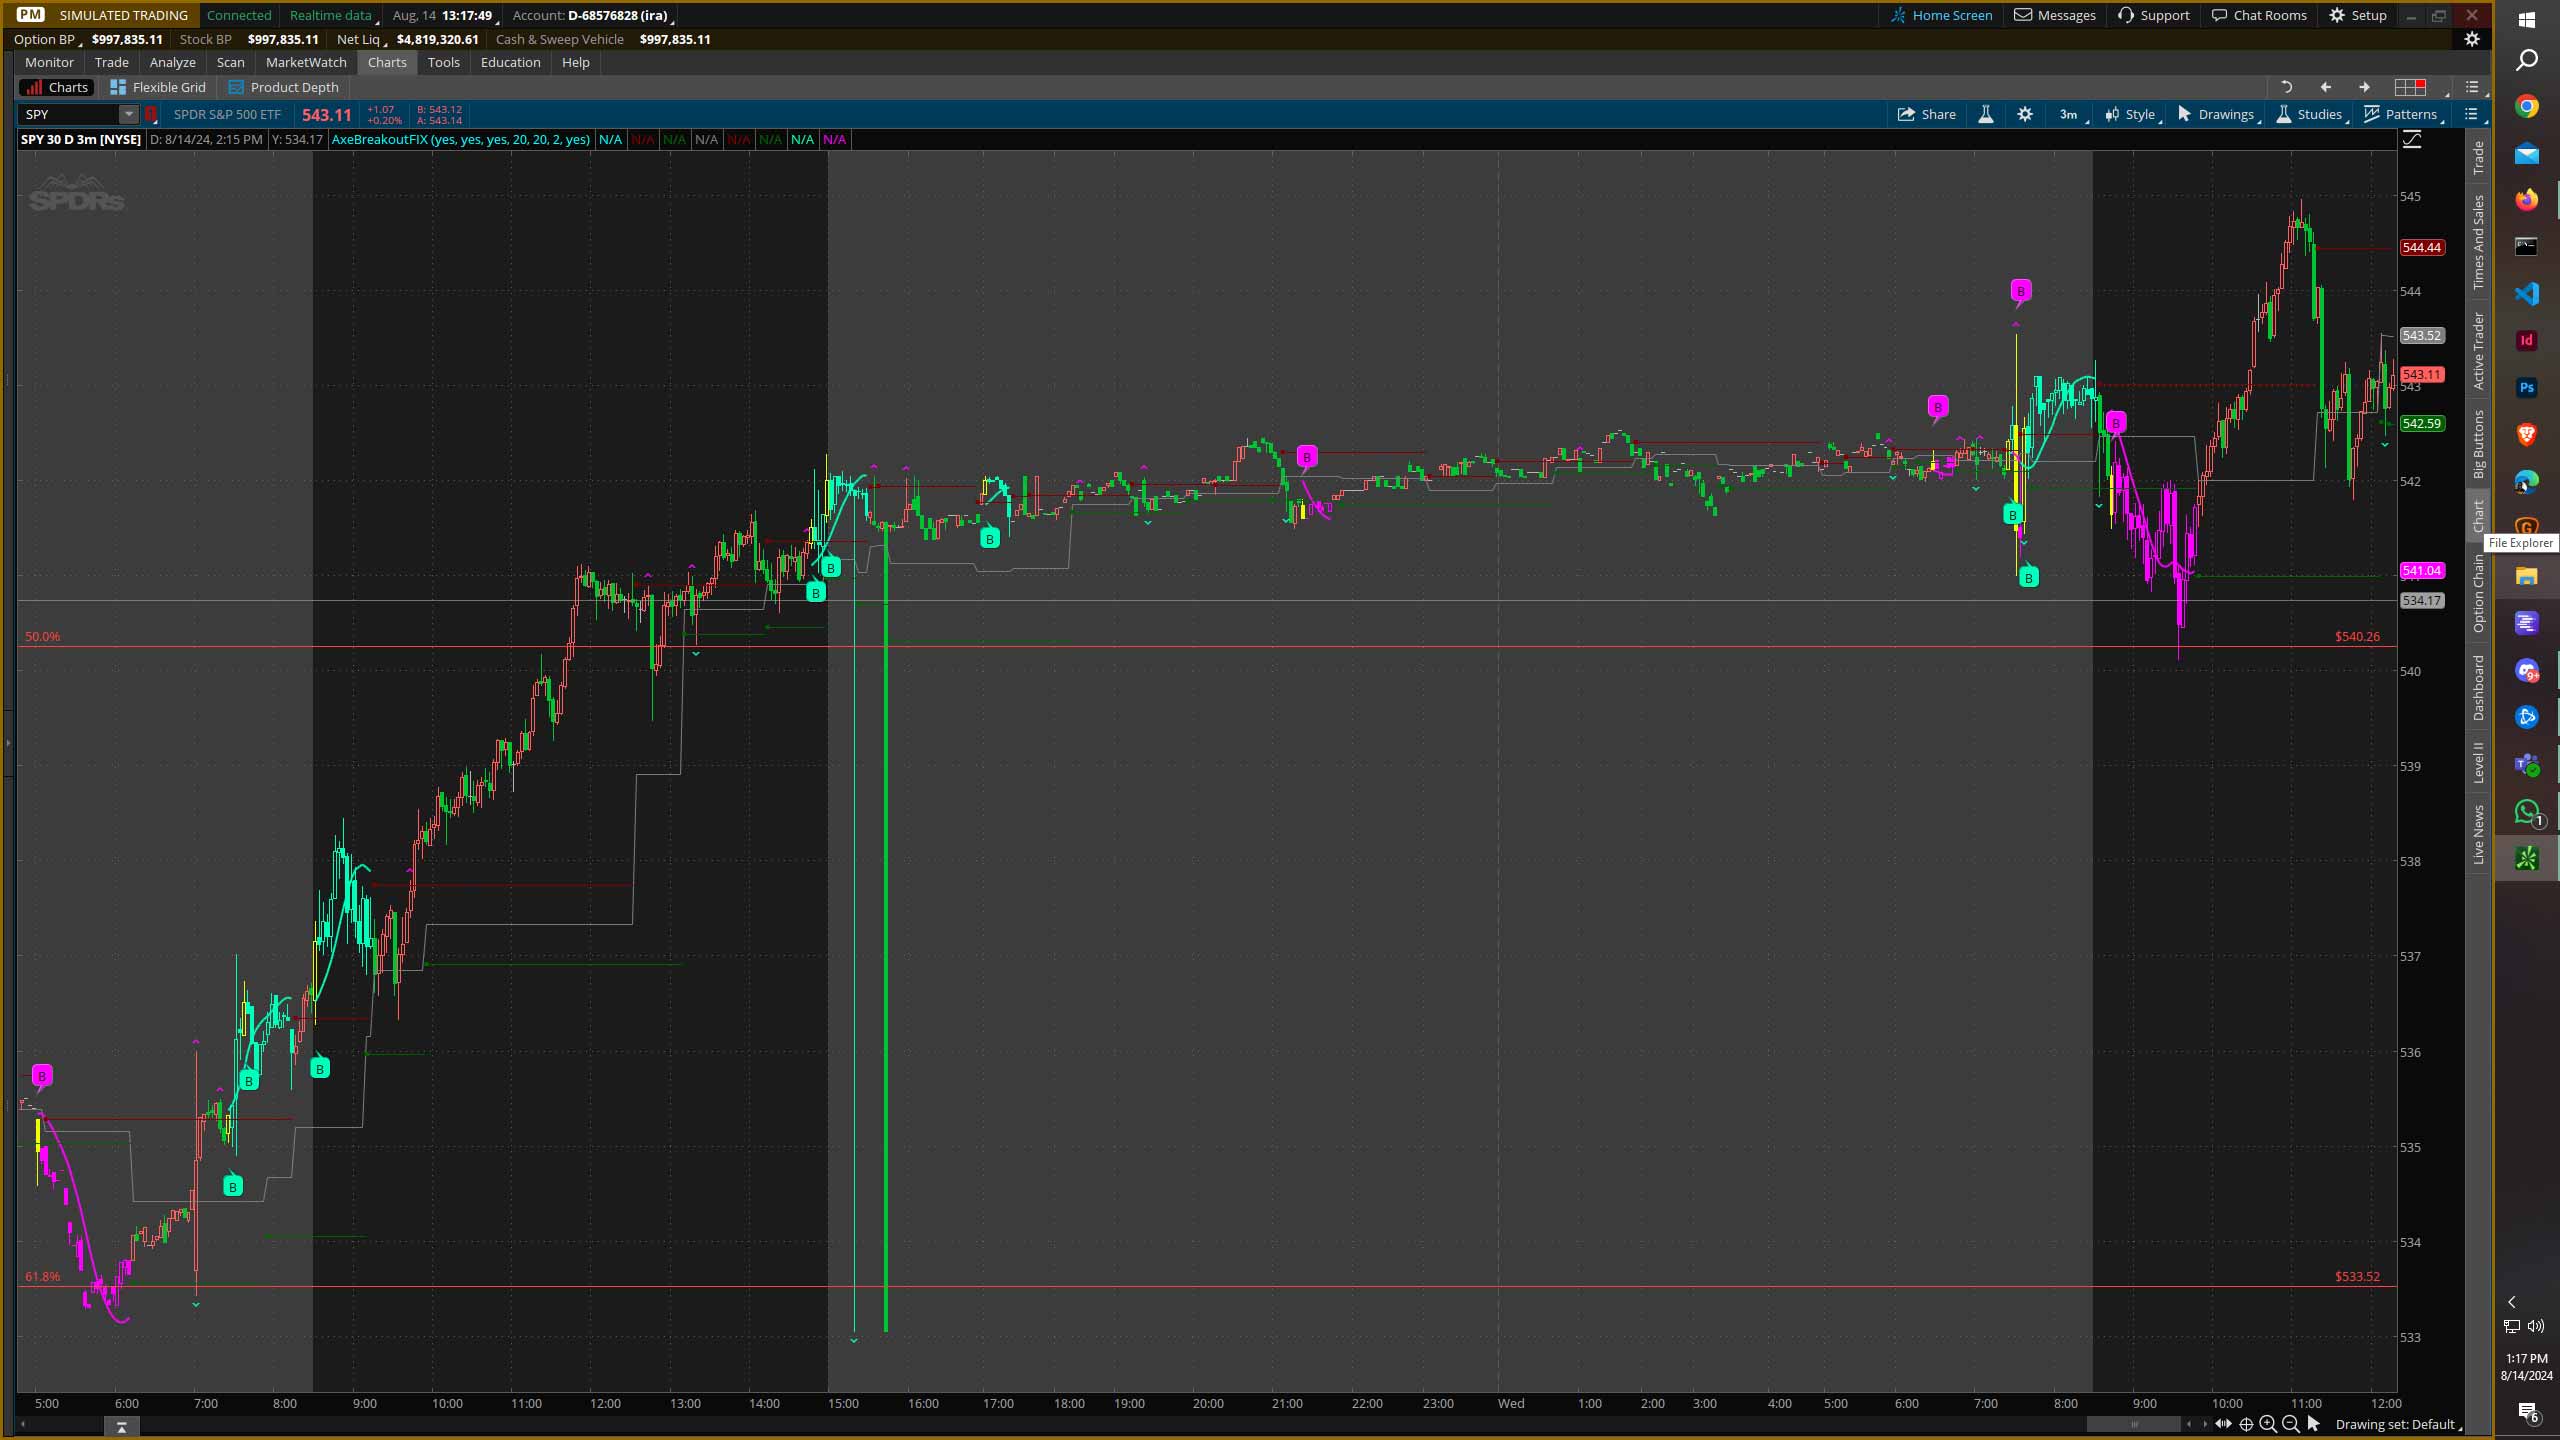
ADVANCE TREND TRACKER WITH BREAKOUT & REVERSAL SIGNALS THINKORSWIM INDICATOR
This ThinkScript is designed to help traders identify key trend movements and potential reversal points with enhanced visual cues. It integrates volume strength analysis and plots crucial trend indicators to assist in making informed trading decisions.
Hull Moving Average (HMA) as Trend Tracker
The Hull Moving Average (HMA) tracks trends, displaying it only when a trend is identified.
Volume Strength
Confirm the significance of breakouts and breakdowns, calculated over a defined period, and a threshold is set to filter strong volume movements.
High, Low Tracker
Tracks the highest and lowest weighted moving averages of price over a specific period, levels are stored & updated dynamically to provide resistance & support levels.
Breakout and Breakdown Detection
Detects breakouts (price closing above the stored high) and breakdowns (price closing below the stored low). It further filters these signals based on volume strength to ensure only significant moves are considered..
Reversal Signals
Bullish and bearish reversal points are identified based on price interactions with the stored high and low levels. The script filters out weak signals to focus on more reliable reversals.
Customization Options
Users can toggle the display of trend lines, midlines, and reversal signals. Candle colors during trends can also be customized.
Visual Enhancements
Trend Colors
Candles are color-coded based on the detected trend, with blue for bullish trends and pink for bearish trends.
High/Low Points
Visual bubbles are added to the chart to indicate breakout points, making it easier to spot key trading opportunities.
Reversal Signals
Significant high and low points are marked with squares, providing a visual reference for traders.
HOW THIS SCRIPT WORKS
- The script begins by calculating the Hull Moving Average (HMA) and relative volume strength.
- It then determines the highest and lowest weighted moving averages over the defined period.
- The script checks for breakouts and breakdowns based on these levels, further confirming them with volume strength.
- Reversal points are identified and plotted, with visual cues to make trading decisions easier.
- Finally, the script assigns colors to candles based on the detected trend and overlays additional signals like bubbles and squares for better visual clarity.
Disclaimer:
This indicator is offered “as is” & is provided free of charge. While it may be used for trading, its primary intention is for research & educational purposes only. The creator of this indicator does not guarantee any specific outcomes or financial results from its use. Users should exercise caution & conduct their own analysis before making any trading decisions. By using this indicator, you acknowledge & accept that you assume all responsibility for any trading actions taken.
